


Whether you view numbers as beautiful or not, there’s no denying they can give a quick and digestible overview of a situation. And right now, that situation is rather dramatic.
In a normal year, you might see mild fluctuations in, say, new car registrations, used car sales and car factory output. But Covid-19 has pummelled the UK’s car landscape like never before (after all, you cannot buy a car if the showroom is closed), following up on the wobble-inducing effects of a-still-not-done Brexit.
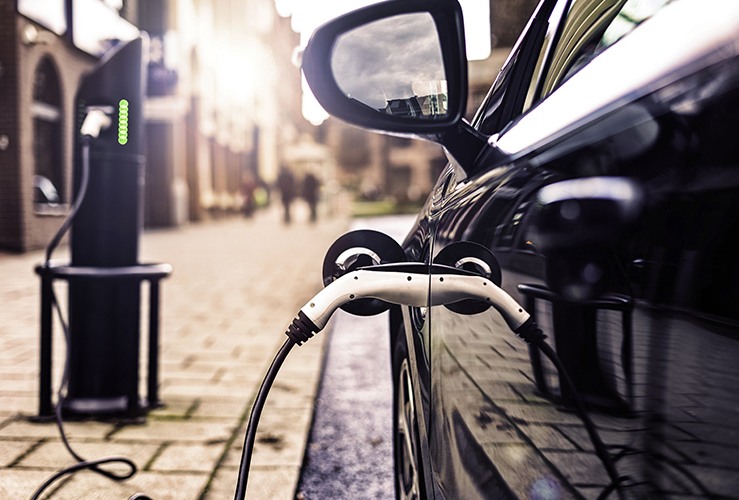
It’s not all doom and gloom, however. There has been a pick up in sales of pure-electric (+77%) and PHEV cars (+221%), while diesel and petrol cars have fallen out of favour (big time). Pure electrics now account for 6.4% of the UK car market, which while modest is more than double 2018’s figure (2.6%).
Anyway, take a look at the following stats, for a general sense of how the realm of UK motoring stands right now...
- There were 599,000 newly registered vehicles in Great Britain during 2020 Q1, representing a fall of 30.1% compared to 2019 Q1. - Gov.uk
- Diesel cars registered for the first time in GB during 2020 Q1 plummeted 45% year-on-year. - Gov.uk
- In March 2020, the first annualised fall in new registrations since 1991 was registered. The 0.2% fall brought the total licensed vehicles to 38.3 million. - Gov.uk
- Restrictions related to the coronavirus (COVID-19) pandemic had a huge impact on car sales, since dealerships and showrooms were forced to close. - Gov.uk
- During May 2019 there were 240,046 new car registrations. During May 2020 there were just 37,079 - an annualised fall of 85%. - Gov.uk
- When it comes to vehicle type, cars have seen the biggest drops due to Covid-19. In April 2019 there were 163,840 new car registrations; in April 2020 there were just 4,240 - a 97% fall. - Gov.uk
- In 1999 there were almost eight million fewer cars on GB roads (23,974,900 compared to 31,888,400 in 2019). - Gov.uk
- German cars dominate the most popular brands in the UK. In Q1 2020, the top 5 were Volkswagen (9.2%), Ford (9.0%), BMW (7.1%), Mercedes-Benz (7.0%), and Audi (6.3%). Back in Q1 2019, the top 5 were Ford (9.6%), Volkswagen (8.4%), Vauxhall (7.8%), Mercedes-Benz (7.4%) and BMW (6.7%). Ford has not been knocked off the top spot for a decade. - Gov.uk
- However, while the total sales accolade goes to Volkswagen, Ford still has the most popular car, with 16 thousand new registrations of the Ford Fiesta in 2020 Q1. - Gov.uk
- Used car sales plummeted from 2,034,236 in Q2 2019 to just 1,039,303 in Q2 2020 - a fall of 48.9%.
- Top used car models reflect those of the new car market. The most popular second hand car was the Ford Fiesta (41,778 sales), followed by the Volkswagen Golf (37,608) and the Ford Focus (36,852).
- Black was the most popular used car colour/shade - with 227,660 transactions.
- The largest number of new car sales was in the South East (151,583), followed by the North West (111,829) and the West Midlands (107,077).
- In 2017 the UK was producing more than 1.7 million cars per year. By August 2020 this had fallen to 954,314.
- Car output fell 44.6% between August 2019 and August 2020.
- 7% of UK made cars are sold overseas (as of Aug 20).
- The EU buys 54.8% of exported UK cars.
- The USA buys 18.9% of exported UK cars.
- In Q1 2020, there was a 65% increase in the number of alternative fuel cars compared to Q1 2019. - Gov.uk
- Q1 2020 saw a 113% increase (+ 33,696) in ULEVS (ultra low emission vehicles) registered in Great Britain compared to Q1 2019. - Gov.uk
- ULEVs still only make up 5.6% of all new registrations. - Gov.uk
- PHEVs (plug-in Hybrid electric vehicles) saw a year-on-year increase of 221.1% August 2020. Market share has grown from 1% in August 2019 to 3.3% in August 2020. - Gov.uk
- BEVs (battery electric vehicles) rose by 77.6% in August 2020 compared to a year earlier. BEV market share is now 6.4%, up from 3.4% in August 2019. - Gov.uk
References